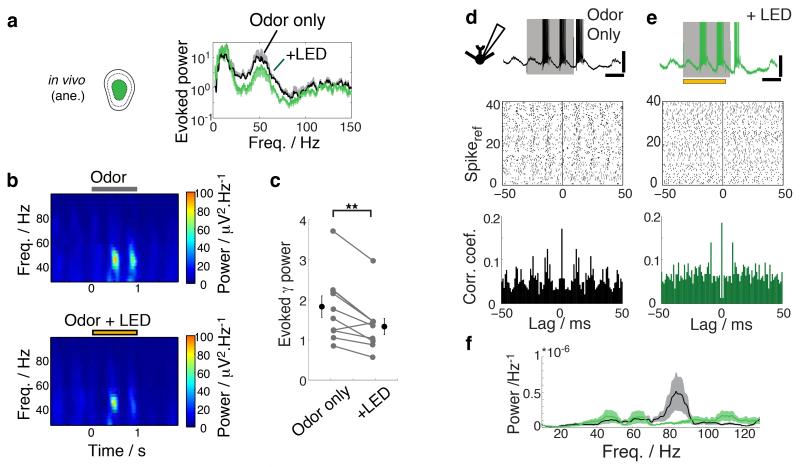
Figure 6. Granule cells coordinate neuronal activities on a fast timescale.
(a) Spectral density estimate for odor period normalized by that for baseline period (“evoked power”) averaged over all recordings (n = 10 recordings from 10 animals). Black = odor only, green = odor + LED. Mean and one standard deviation shown. Example spectrograms with odor only (top) and with additional GCL silencing (yellow bar; bottom). Hotter colors indicate greater power. Spectrograms are the average from 17 trials each. (c) Summary of evoked power averaged over gamma frequencies (40-100 Hz). Mean ± s.e.m. shown. (d-f) Gamma range activities on a single cell level. (d) Example of excitatory response evoked in an example TC (top). Gray bar indicates time of odor presentation. Scale bars = 20 mV, 0.4 s. (middle) Spike raster where timings of evoked APs are shown relative to a selected evoked spike (spikeref) for 40 randomly chosen spikeref. Spike autocorrelogram for this example cell is shown at the bottom (see methods). (e) as in (d) but with additional GCL silencing (yellow bar, top). Scale bars = 20 mV, 0.4 s. (f) Power spectra were obtained from the spike autocorrelogram for all TCs that showed excitatory responses (n = 9 cells from 8 animals) and averaged. Mean ± s.e.m are shown for odor only (black/gray) and with LED (green/pale green) conditions. Odors used = isoamylacetate, salicylaldehyde, eugenol, methylsalicylate and cinnamaldehyde at 2-5 % saturated vapor.

