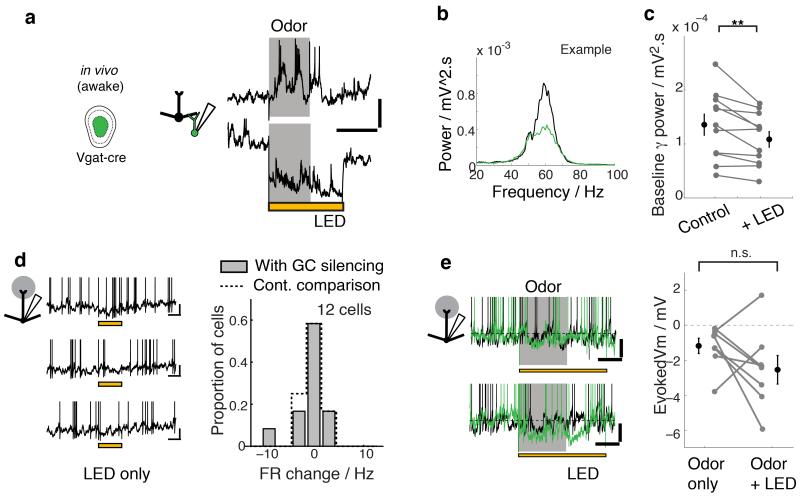
Figure 7. GCs contribute to fast, but not slow activities in awake animals.
Whole cell and LFP recordings were made in the OB of awake, head-fixed Vgat-cre mice with AAV-FLEX-ArchT injection in the GCL (“GC silencing”). (a) Example whole cell recording from an infected GC that responded with AP discharge to stimulation with 5% of isoamylacetate. Odor-evoked responses under control conditions (top) and during light application (bottom). Scale bars, 20 mV, 1 s. (b) Spectral density estimates for an example LFP recording without external stimulus. Black = control, green = with LED. (c) Summary of average gamma power in the LFP (40-100 Hz). Mean ± s.e.m. shown. n = 11 recordings from 8 animals. (d,e) Effect of GC layer silencing on slow M/TC activities. (d) Effect of GC silencing on the baseline M/TC firing rates. Vm traces with repeated light presentations for an example cell (left). Scale bars = 10 mV, 0.5 s. Summary histogram of average firing rate change with light is shown on the right (FRLED – FRControl; n = 12 M/TCs from 5 animals). (right) Histogram shown with dotted line is for the baseline variability (FRControl2 – FRControl1; see Methods). (e) Effect of GC silencing on odor-evoked inhibition. (left) Example recordings from 2 cells where an odor evoked hyperpolarization during control (black traces), and the effect of GCL silencing (green traces). Scale bars = 5 mV, 0.5 s. Evoked Vm are summarized on the right; mean ± s.e.m. shown. (n = 8 cell-odor pairs from 3 animals). Odors used = isoamylacetate, salicylaldehyde, eugenol, methylsalicylate, acetophenone and ethylbutyrate at 1-3 % saturated vapor.

