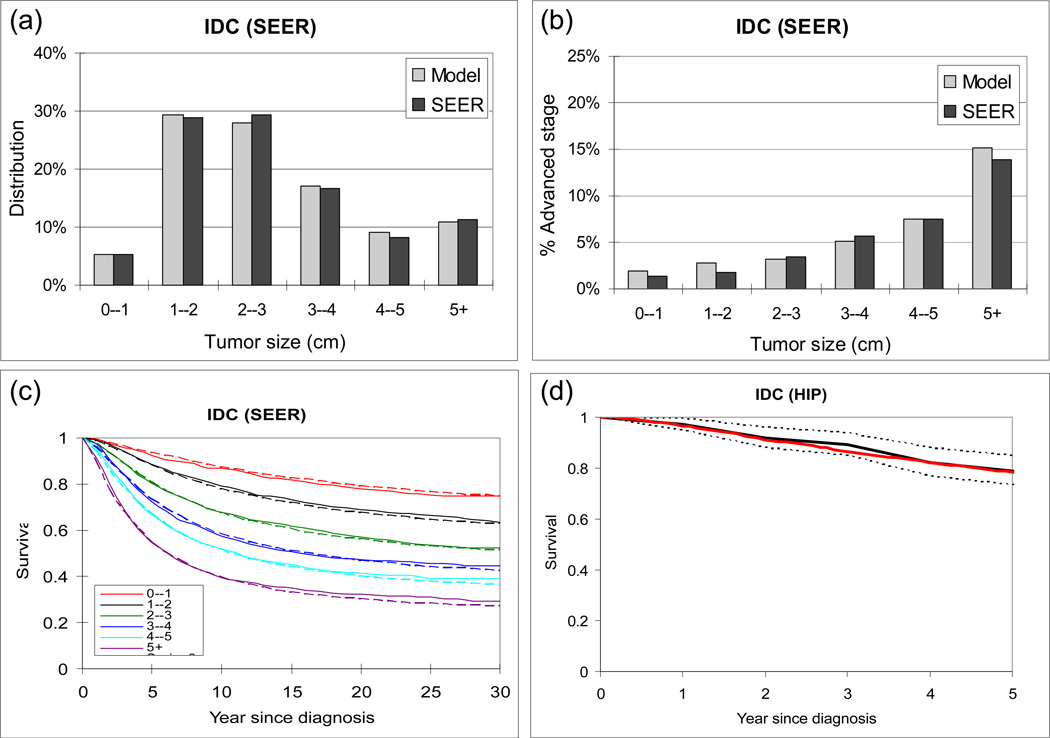
Figure 3.
Model validation for invasive ductal carcinoma (IDC) symptomatically detected in the absence of screening. (a) Distribution of tumor size (diameter in cm) predicted by model (grey) and observed in SEER (black). (b) Proportion of advanced stage diseases (stratified by tumor size) predicted by model and observed in SEER. (c) Disease-specific survival predicted by model (dashed curves) and observed in SEER (solid curves). The red, green and black curves represent early stage, advanced stage, and all cases, respectively. (d) Disease-specific survival predicted by model (red solid curve) vs. observed in the HIP non-screened participants diagnosed from 1975 to 1979 (black solid curve). The black dotted curves represent 95% confidence interval of HIP.

