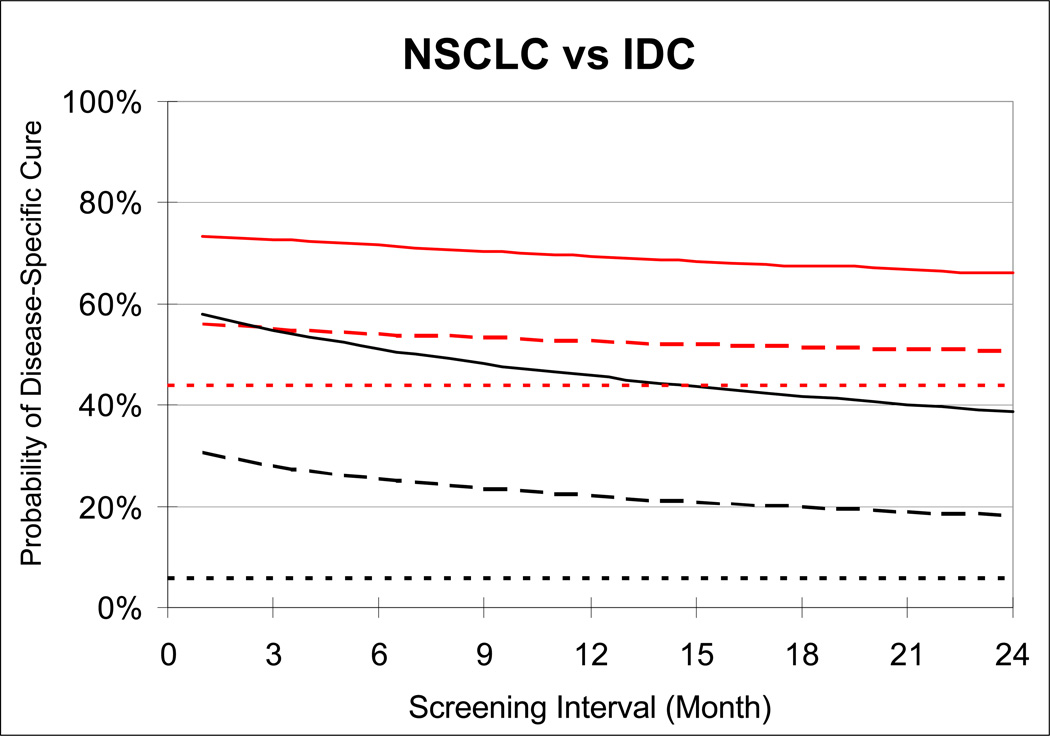
Figure 5.
Estimated probability of disease-specific cure for NSCLC (black curves) and IDC (red curves) in the absence of screening (dotted curves) and under two alternative screening detection thresholds (solid curves: 5mm; dashed curves: 15mm) and screening intervals (1 to 24 months). The disease-specific mortality reduction from screening is computed as difference between the probability of disease-specific cure in the presence and absence of screening divided by one minus the probability of disease-specific cure in the absence of screening. All estimates are limited to patients who would have been symptomatically detected in the absence of screening.

