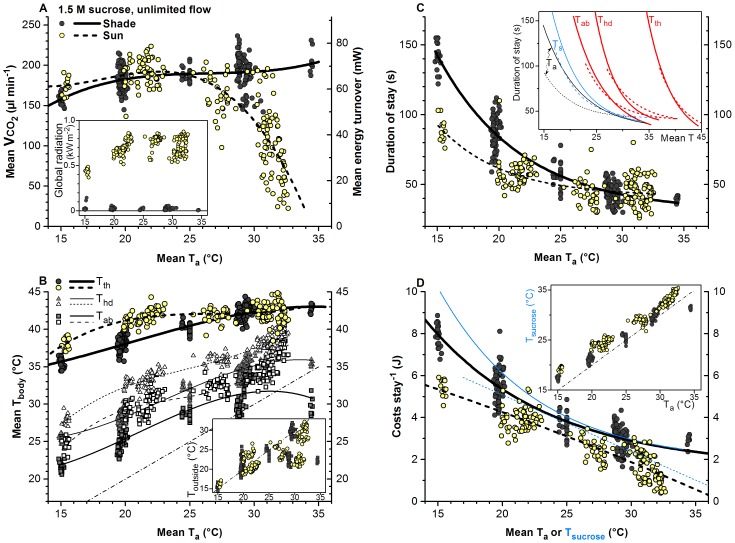
Figure 2. Energetics and thermoregulation of honeybees foraging sucrose in shade (grey/filled symbols) and in sunshine (yellow/open symbols).
One symbol represents one mean per stay (N = 217 stays in shade and 183 in sunshine; 20 bees). (A) CO2 production rate (VCO2), (B) body surface temperature of head (Thd), thorax (Tth) and abdomen (Tab), (C) duration of stay, (D) costs per stay, and environmental parameters were measured simultaneously in all individuals. Dashed-dotted line in (B): isoline. Ta = ambient air temperature near the bees in the measurement chamber, Toutside = temperature in shade outside the measurement chamber, Ts = sucrose temperature. Regression lines (all P<<0.0001, ANOVA): (A, B) cubic (y = A+B*x+C*x2+ D*x3); (C, D) exponential decay (y = A1*e(−x/t1)+y0)), for constants and statistics see Table 1. Inserts: if not given, axes labelings as in main graphs; insert in (C): Ta, Ts, Tab, Thd, Tth refer to x-axis temperature to be used, respectively.

