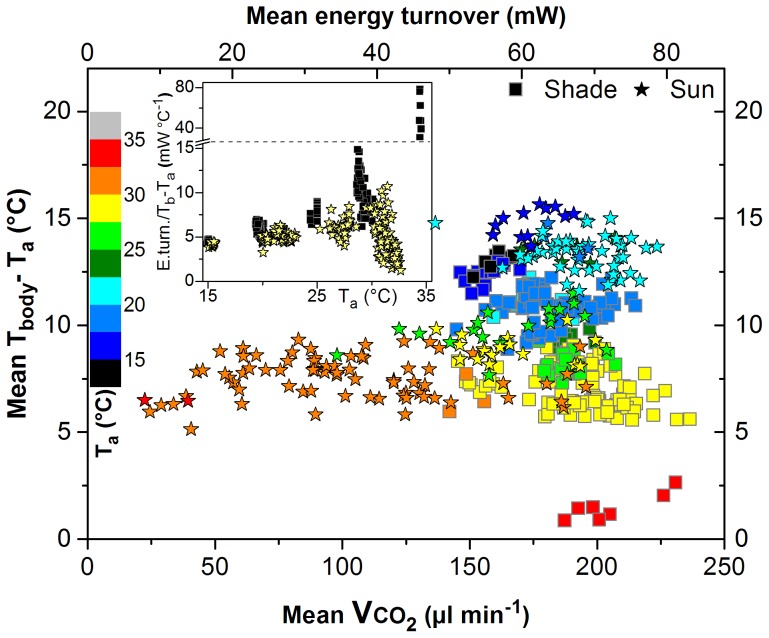
Figure 5. Mean body surface temperature excess over ambient temperature (Tbody–Ta) per stay, in dependence on mean CO2 production rate (VCO2) or energy turnover, and Ta (colour scale), in shade (squares) and in sunshine (asterisks).
Bees foraged 1.5 M sucrose solution from an unlimited flow feeder. Insert: Quotient of energy turnover (E.turn.) and body temperature excess (Tb–Ta) in dependence on Ta. N = 217 in shade and 183 in sun. Tb = Tbody (mean of head, thorax and abdomen).

