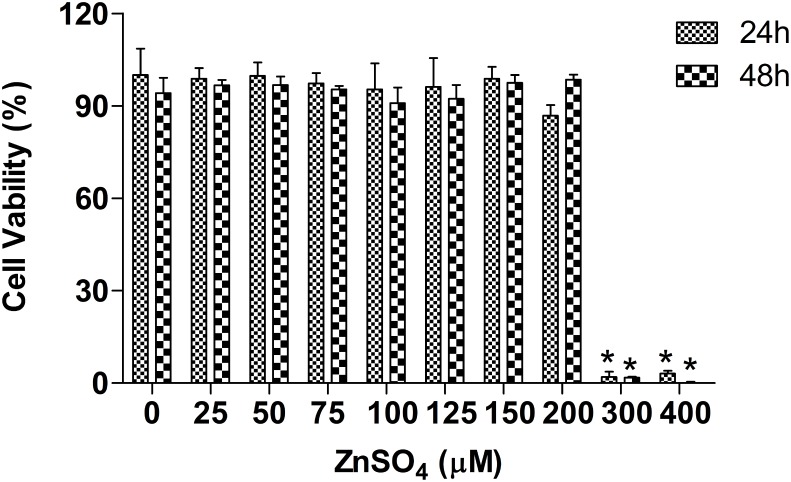
Figure 1. Cell viability analysis of A549 cells after treatment with ZnSO4.
Cell viability of A549 was assessed using the WST-8 method after treatment with various doses of ZnSO4 for 24 h or 48 h. (data are presented as mean ± SD, *p≤0.05 versus controls, n = 3). A sub-cytotoxic metal concentration (100 µM) and exposure time (24 or 48 h) were selected for 2DE, Western blot and RT-PCR analyses.

