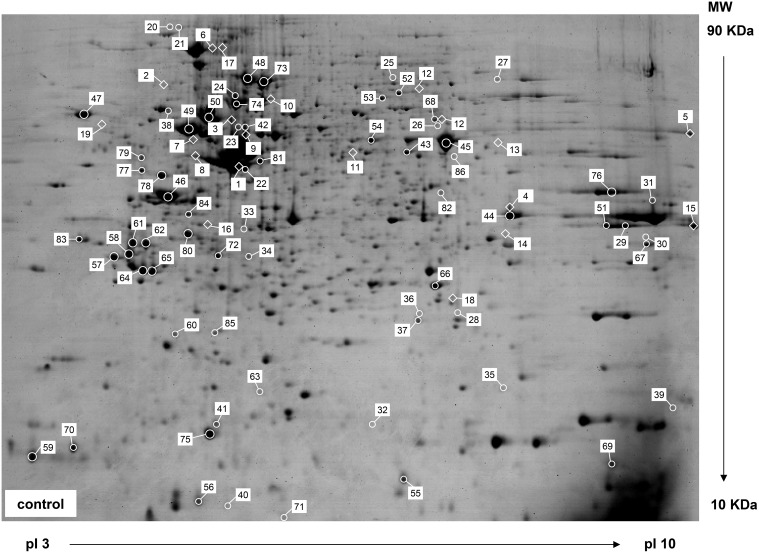
Figure 2. Representative 2DE gel of soluble proteins in A549 cells stained with CBB.
Each protein sample (1 mg) was separated by IEF in a 24 cm long IPG gel strip containing a wide-range linear pH gradient of 3–10, followed by SDS-PAGE on a vertical 12% gel. Proteins differentially expressed in response to excess Zn (100 µM ZnSO4 for 24 h) are illustrated with a diamond symbol. These proteins showed a two-fold or greater difference in abundance (p≤0.05) in A549 cells. Other proteins identified are labeled with a ring symbol.

