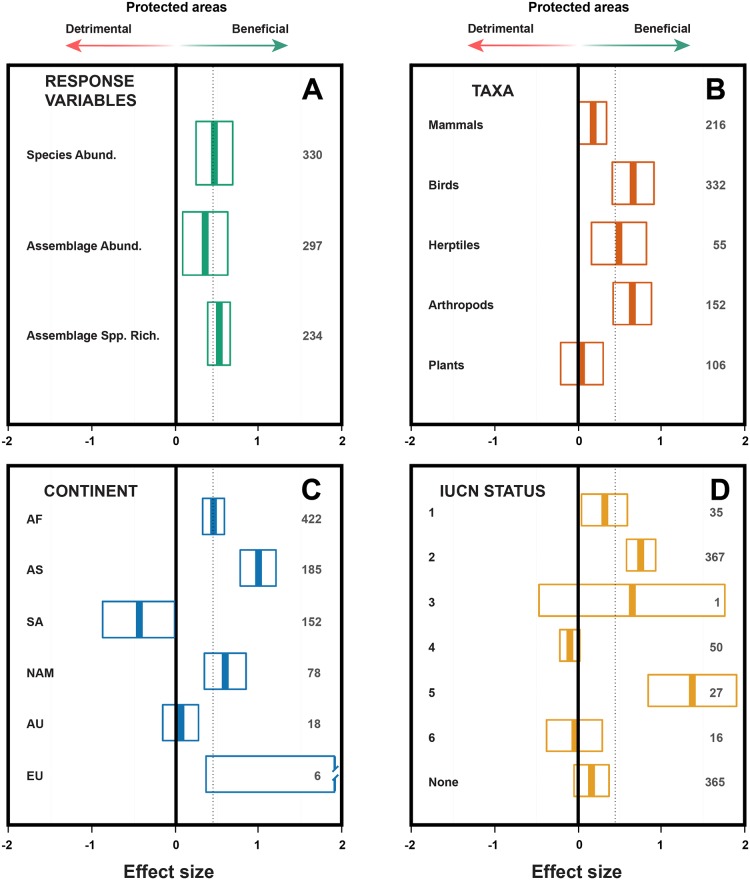
Figure 2. Effect sizes and 95% confidence intervals of response variables (A), taxa (B), continent (C) and the Protected Areas IUCN category (D).
Positive boxplot values indicate a net positive impact of protected areas (PAs) on biodiversity. Sample sizes are in grey, the vertical black lines show a zero effect size, while the dashed lines show the overall effect size of 0.444. The effect size for the truncated bar (Europe; Panel C) with large variance due to low sample sizes is 2.54 CI: 0.36–4.73. Abund = Abundance; Spp. Rich. = Species richness; AF = Africa; AS = Asia; SA = South America; NAM = North America; AU = Australasia; EU = Europe. IUCN categories are detailed in Appendix S2.

