
Figure 5. Histograms of correlation coefficients (top) and their Fisher transforms (bottom) observed on Jun 15, 2011 for lags  (a) and 80 (b) days, and randomly shuffled returns (c).
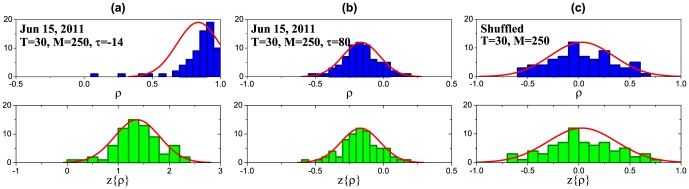
Stock and market volatilities are calculated using an SMA with the window  days. The correlations between them are calculated using an SMA with the window
  days. The red curves denote fitted normal distribution. In the case of large correlations, the Fisher transform makes the highly skewed distribution approximately Gaussian (a).