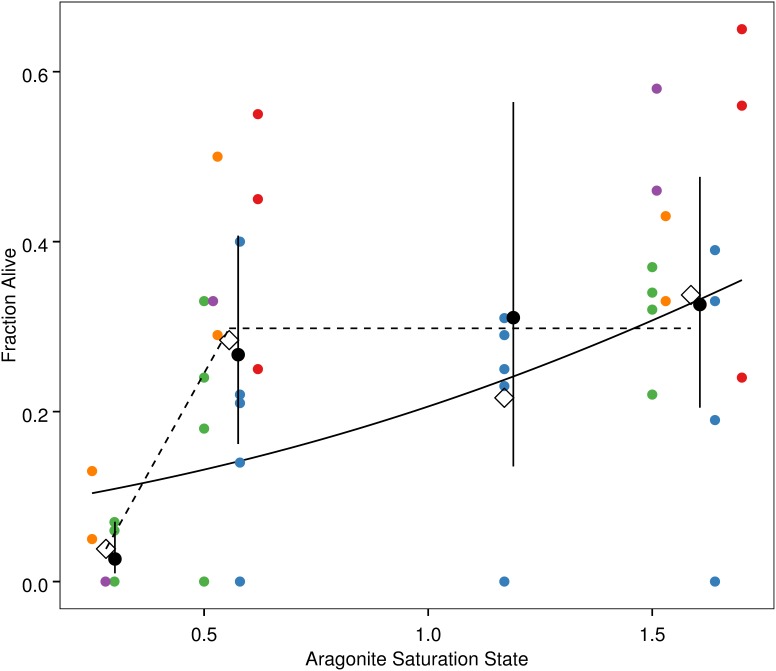
Figure 2. Pteropod survival as a function of Ωa.
Small colored circles: fraction surviving within an individual jar, with May experiments in warm colors and July experiments in cool colors; open diamonds: overall fraction of pteropods surviving at the mean Ωa for a given treatment; small black circles with vertical bars: expected value and 95% confidence intervals calculated from the best-fit discrete mixed effects model, with small x-axis offset from the treatment mean Ωa; solid line: best-fit linear relationship from continuous mixed effects model; dashed line: hypothetical “broken-stick” relationship.

