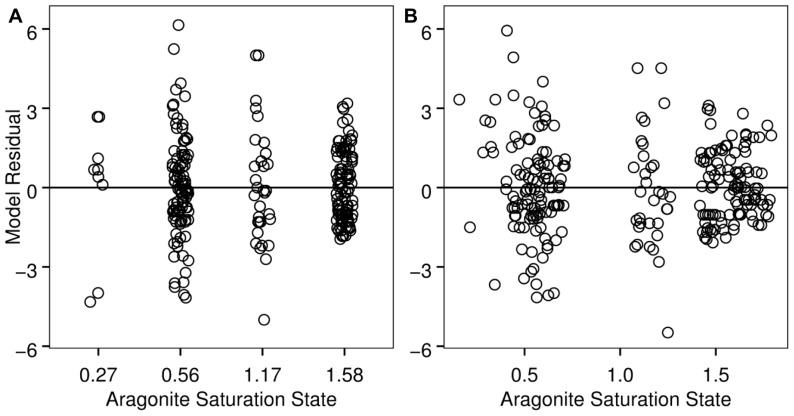
Figure 4. Shell condition model residuals as a function of Ωa (discrete model, a; continuous model, b).
Data are shown with a small x-axis offset from the treatment mean Ωa for better visualization of overlapping points. The plots indicate that the data are reasonably consistent with model assumptions of homoscedasticity.

