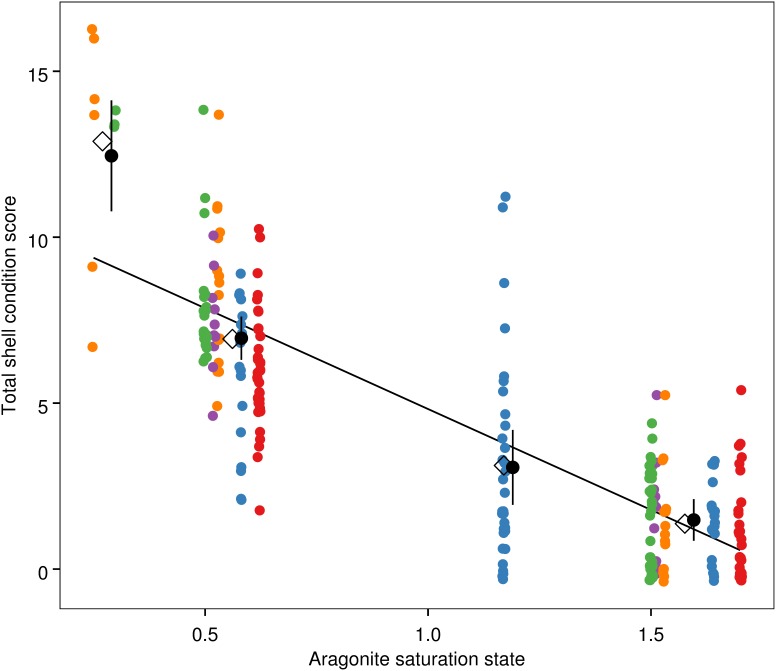
Figure 5. Pteropod sum shell condition score as a function of Ωa.
Small, colored circles show the sum score for individual pteropods, with May experiments in warm colors and July experiments in cool colors. These points were plotted with small random offsets to prevent overlap. Open diamonds: treatment mean at mean Ωa for a given treatment; small, black circles with vertical bars: expected value and 95% confidence intervals calculated from the best-fit discrete mixed effects model, with a small x-axis offset from the treatment mean Ωa; solid line: linear relationship from continuous mixed effects model.

