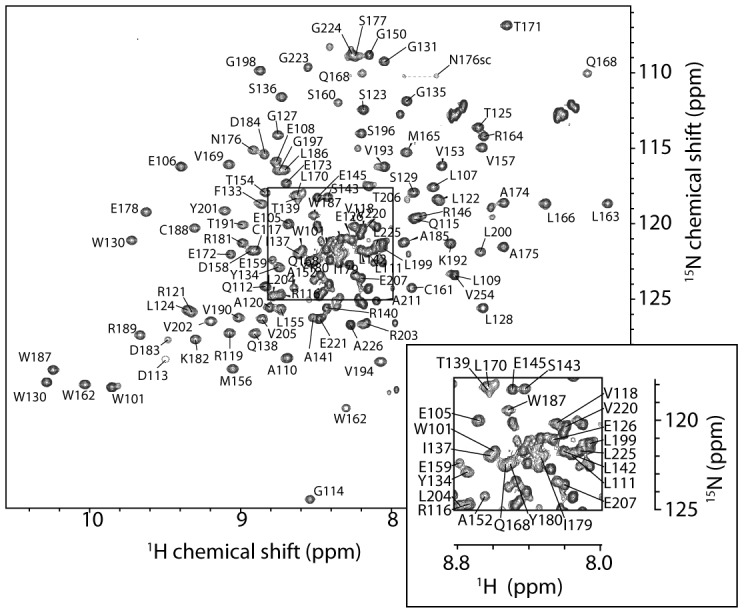
Figure 2. 15N-HSQC spectrum of FOG1.

The spectrum was recorded on 0.5 mM FOG-PR at 298 K on a 600-MHz NMR spectrometer. The central portion of the spectrum (boxed) is labeled with assignments in the expansion. Signals with no label are unassigned.

The spectrum was recorded on 0.5 mM FOG-PR at 298 K on a 600-MHz NMR spectrometer. The central portion of the spectrum (boxed) is labeled with assignments in the expansion. Signals with no label are unassigned.