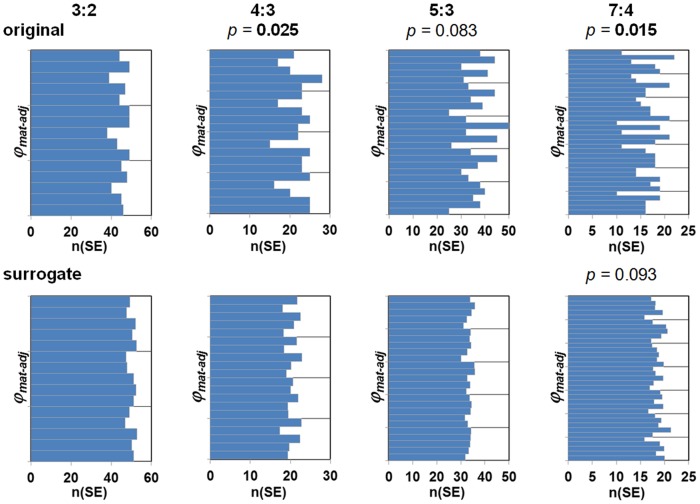
Figure 3. Distribution of the synchronization epochs (SE) over the maternal beat phase φmat-adj in the original (top row) and surrogate data (bottom row) with respect to the n:m combinations 3:2, 4:3, 5:3 and 7:4.
For the analysis, there were 10 surrogate data sets for each original; the histograms show the number of surrogate SE divided by 10 for comparability. p-values <0.10 for non-uniform distributions are given above the respective histograms, p-values <0.05 in bold type.

