
Figure 4. Fixed-effect model forest plot of HR of DFS in pathologic stage subgroup analysis according to EGFR mutation status.
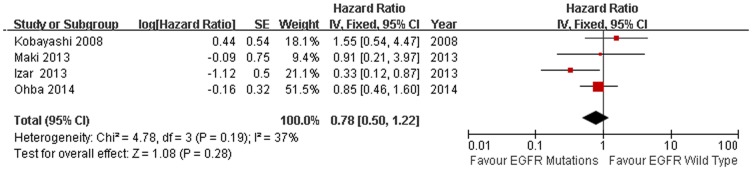
Solid diamond indicates the pooled HR of DFS, square indicates hazard ratio value of each study.
Official websites use .gov
A
.gov website belongs to an official
government organization in the United States.
Secure .gov websites use HTTPS
A lock (
) or https:// means you've safely
connected to the .gov website. Share sensitive
information only on official, secure websites.
Solid diamond indicates the pooled HR of DFS, square indicates hazard ratio value of each study.