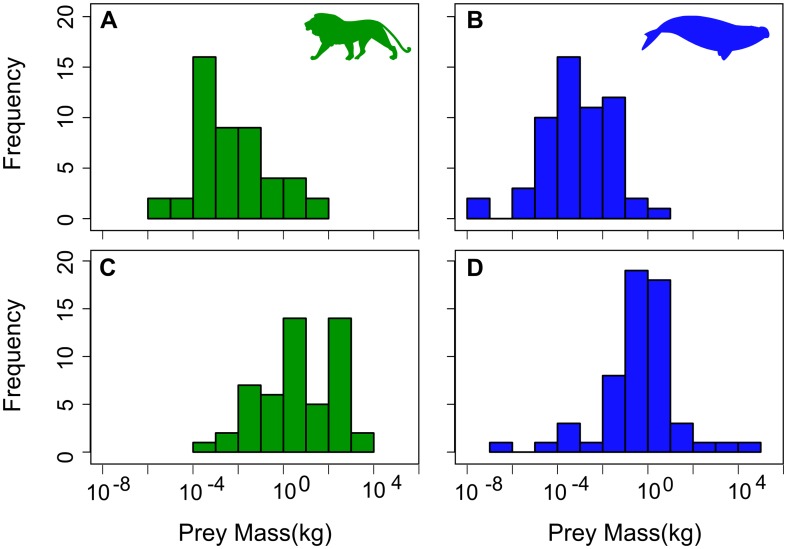
Figure 2. Distributions of the minimum prey mass for (A) terrestrial carnivorous mammals (green bars) and (B) aquatic carnivorous mammals (blue bars), and the maximum prey mass for (C) for terrestrial carnivorous mammals (green bars) and (D) for aquatic carnivorous mammals (blue bars).
Silhouettes by uncredited and Chris Huh were downloaded from http://phylopic.org.

