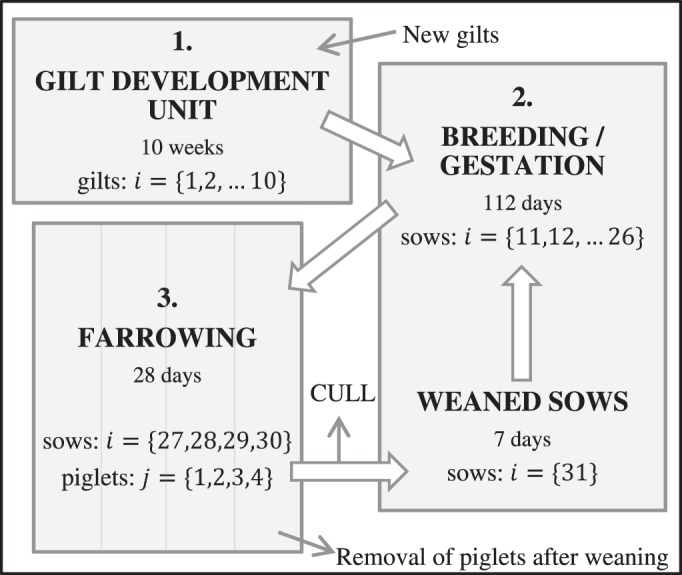
Figure 1. Schematic of a standard commercial swine breeding farm showing the demographic and spatial structure assumed in our mathematical model.

This farm houses gilts (female pigs that have not yet been mated), sows (female pigs) and piglets (young pigs). There are three separate buildings (indicated by the shaded boxes), and the farrowing building is subdivided into four rooms. Farrowing means the production of a litter of piglets, and weaning is the separation of a sow and her piglets. New gilts enter the gilt development unit (building 1) at a replacement sow rate of 50% year−1. From here, animals are moved to building 2 and inseminated. Typically, swine farmers rely primarily on artificial insemination for breeding and house only a small number of boars, thus we have excluded boars from the model. After 112 days, pregnant sows are moved to building 3, where 2–7 days later they give birth to an average of 12 piglets per sow. Sows remain in building 3 for 28 days, and then are moved back to building 2. After one week, insemination takes place again, and this cycle continues. Weaning occurs twice a week. After weaning, piglets are removed from the breeding farm. The overall death/removal rate for sows is 50% year−1, with 80% of this occurring after weaning at the cull of unproductive sows. The natural death rate for piglets is 10% from birth to weaning. Class indices  (gilts and sows) and
  (piglets) (see Table 1) are indicated.
