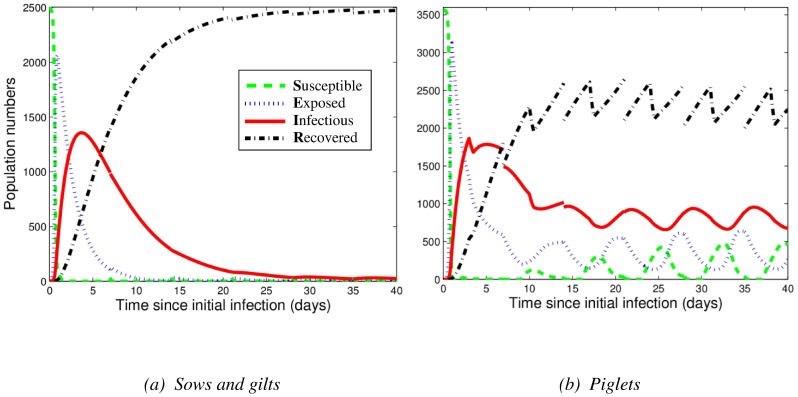
Figure 2. Influenza dynamics as predicted by the breeding farm model, for (a) sows and gilts and (b) piglets, in a naïve (non-vaccinated) population.
At time 0, one infectious gilt enters the breeding farm. Note that in panel (b) the piglets include both those with no maternal immunity and those with a reduced susceptibility due to maternal immunity. The discontinuities in the curves in these figures (and in subsequent figures) are caused by the weekly movement of swine through the farm or the removal of weaned piglets from the farm (as described in the Methods). The equilibrium dynamics are those after the initial peak in the number of infectious animals; these continue beyond the 40 days shown here.

