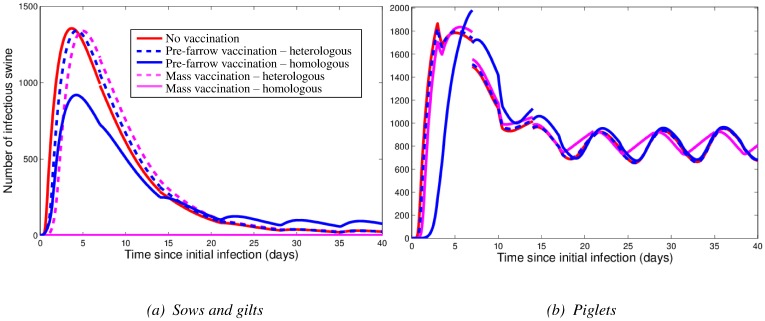
Figure 4. Summary of the effects of vaccination strategies on the number of infectious animals in the breeding farm, for (a) sows and gilts and (b) piglets.
In (a), note that the ‘Mass vaccination – homologous’ curve lies along the x axis (as infection is eliminated). In (b), the ‘Mass vaccination – heterologous’ curve is mainly obscured by the ‘Pre-farrow vaccination – heterologous’ curve, which is very similar. For these results, vaccination occurs prior to the introduction of influenza.

