
FIG 4.
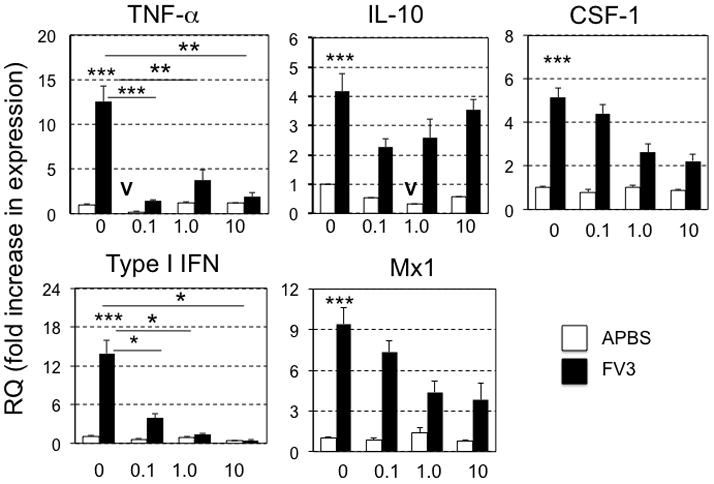
Quantitative gene expression analysis by qRT-PCR in stage 56 X. laevis tadpole kidneys for TNF-α, IL-10, CSF-1, Type I IFN, Mx1, 6 days after i.p. injection with either FV3 or mock-infection with APBS. Results are means ± SEM comprised of 5 to 6 individuals per group and are representative from two different experiments. Statistical significance (ANOVA): (*) P<0.05, ** P<0.005, *** P<0.001 (V) Denotes significant decrease (P<0.05) of basal gene expression in uninfected, atraizine-treated animals compared to non-atrazine exposed controls. Gene expression is represented as fold increase (RQ: relative quantification) relative to GAPDH endogenous control and standardized to uninfected non-atrazine exposed controls (fixed as 1).