
FIG 5.
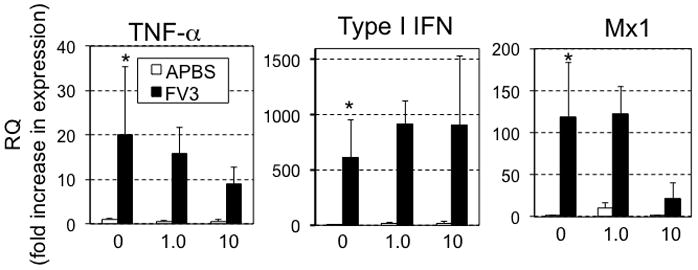
Quantitative gene expression analysis by qRT-PCR in 1-year old X. laevis adult kidneys for TNF-α, Type I IFN, Mx1 6 days after i.p. injection with either FV3 or mock-infection with APBS. Results are presented as means ± SEM from mock-infected (N=3/group) and infected frogs (N=4–5/group). Statistical significance (ANOVA): (*) P<0.05 between non-infected and infected sham-atrazine exposed controls. There was no statistical difference between atrazine exposed and sham-exposed infected groups. Gene expression is represented as fold increase (RQ: relative quantification) relative to GAPDH endogenous control and standardized to uninfected non-atrazine exposed controls (fixed as 1).