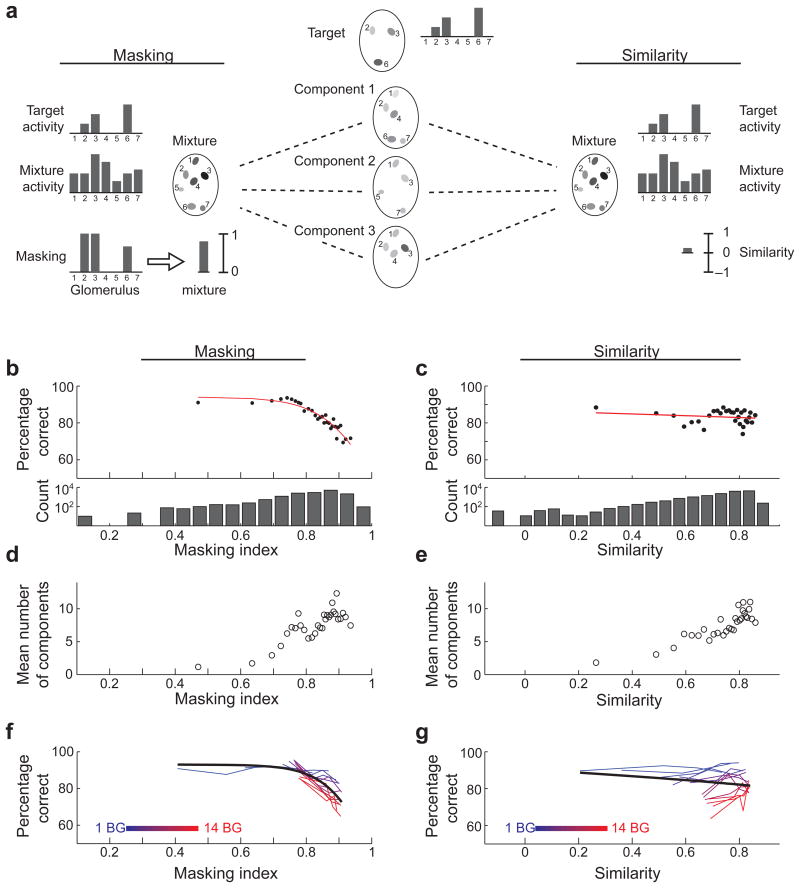
Figure 6. Performance on the task depends on masking at the level of olfactory bulb inputs.
(a) Estimation of the masking of target inputs to the olfactory bulb by a background mixture (left), and of the correlation between target and mixture inputs (right). Mixture responses are modeled as the linear sum of the responses to the individual components. Masking (bound between 0 and 1) is calculated for each target-activated glomerulus and the masking of all glomeruli is then averaged to obtain the mixture masking value. Gray scale levels in the cartoon glomeruli denote activity level. (b,c) Percent of NoGo trials that were correctly rejected as a function of target masking (b) and target-mixture correlation (c). Data was binned to have 500 trials in each bin. Red lines are fits of a logistic sigmoidal decay to the data (see methods). Below are the distributions of masking and correlation values for all mixtures presented in NoGo trials. (d,e) Average number of components in the mixture as a function of mixture masking (d) and target-mixture correlation (e). (f,g) Percent of NoGo trials with fixed number of components in the mixture that were correctly rejected as a function of target masking (f) and target-mixture correlation (g). Each curve shows the data from a fixed number of components in the mixture (indicated by color). Symbols show the average percent of correct rejections.

