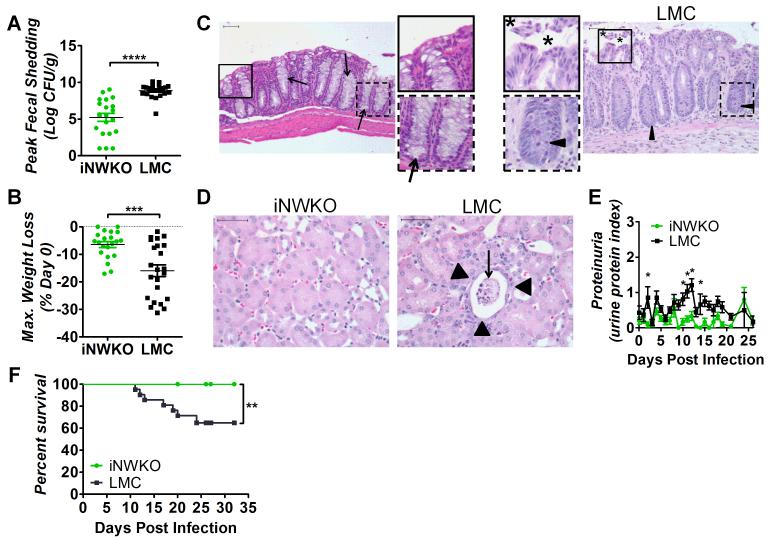
Figure 3. N-WASP promotes high-level colonization and systemic disease during C. rodentium (Φstx2dact) infection.
(A) Fecal shedding by iNWKO or littermate control mice infected with C. rodentium (Φstx2dact) shown as peak CFU (± SEM) of 21 iNWKO and 22 littermate controls from a compilation of five experiments. (****, p<0.0001 by unpaired t-test). (B) Maximum percent body weight loss during infection of iNWKO or littermate control mice infected with C. rodentium (Φstx2dact) (±SEM) of 21 iNWKO and 23 littermate controls from a compilation of five experiments. (***, p<0.001 by unpaired t-test). (C, D) H&E stained intestinal (C) and kidney (D) sections of iNWKO and littermate control mice infected with C. rodentium (Φstx2dact) at 11 days post-infection. Scale bars measure 50 μm. Insets: magnification of original images. (C) Asterisks indicate disrupted and sloughed intestinal mucosa. Arrow heads and arrows indicate inflammation and goblet cells, respectively. Magnification, 200x. (D) Arrowheads indicate flattened tubule lining and arrows indicate sloughed tubules and necrotic tissue. Magnification, 400x. (E) Urine protein content, represented as average protein index (±SEM), in iNWKO and littermate control mice infected with C. rodentium (Φstx2dact). Data are a compilation of three experiments, comprising a total of 15 iNWKO and 16 littermate control mice. (*, p<0.05 by repeated measures 2-way ANOVA followed by Bonferroni post-tests; in addition, as described in Materials and Methods, the return of average proteinuria toward baseline depicted in the graph preceded clinical recovery of individual mice by a few days). (F) Percent survival of iNWKO and littermate control mice infected with C. rodentium (Φstx2dact). Data represent a compilation of five experiments, comprising a total of 19 iNWKO mice and 21 littermate controls. Statistical significance was determined using a Log-rank (Mantel-Cox) Test, revealing a significant (p<0.01) difference between the two groups.

