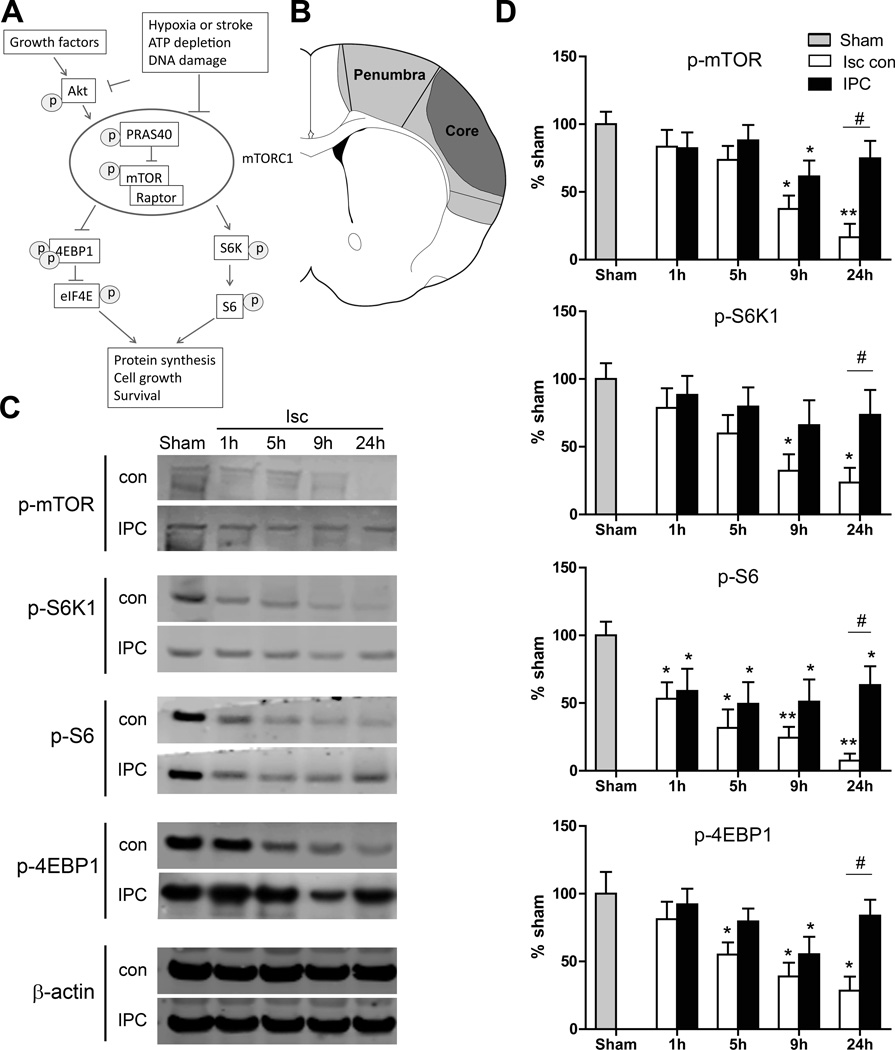
Figure 1.
The effects of IPC on protein expression in the mTOR pathway. A, Diagram showing the major proteins in the mTOR cell signaling pathway. P indicates phosphorylation. B, Brain schematic showing the ischemic penumbra and core regions. The ischemic penumbra, which represents tissue spared by IPC, was dissected for Western blot analysis. The core is the area of infarct that received IPC. C, Representative protein bands of a Western blot for p-mTOR, p-S6K1, p-S6 and p-4EBP1 at 1, 5, 9, and 24 hours post-stroke. β-actin indicates equal protein loading. D, Relative optical densities of protein bands, normalized to those in the sham group and expressed as percentages. *, ** vs sham, P<0.05, 0.01, respectively; #P<0.05, between the two indicated groups. n=8/group. Isc con, ischemic control; IPC, ischemic postconditioning.

