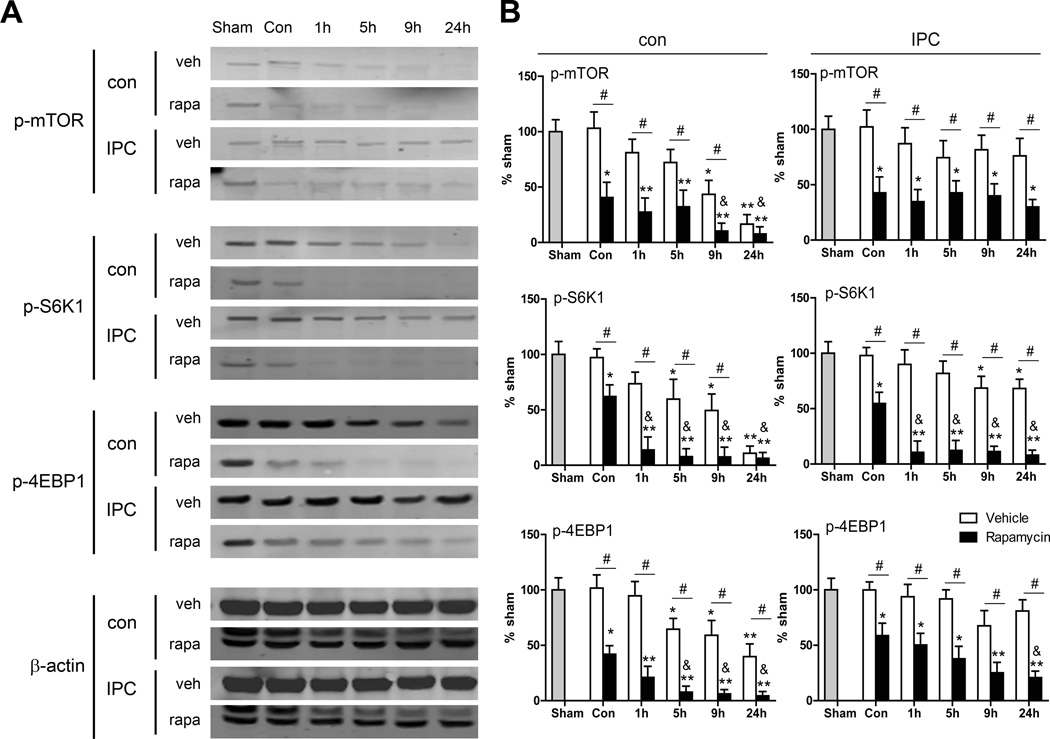
Figure 3.
The effects of rapamycin on protein levels in the mTOR pathway. A, Representative protein bands of major proteins in the mTOR pathway. B, Quantified levels of each protein. *, ** vs. sham brain, P<0.05, 0.01, respectively; &, vs. con (non-ischemic control with rapamycin injection), P<0.05; #, between the two indicated groups, P<0.05, 0.01, respectively. n=8/group. Isc, ischemic; con, control; IPC, ischemic postconditioning; rapa, rapamycin.

