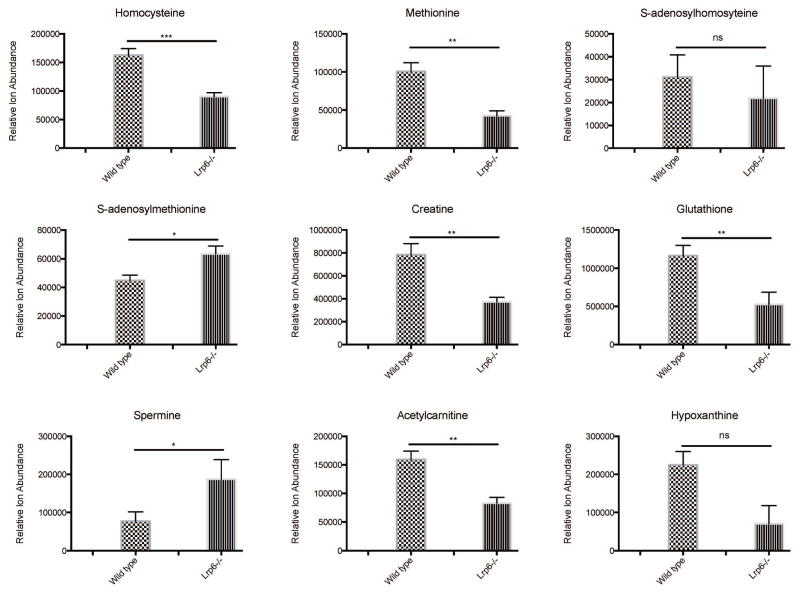
Figure 4. Statistically significant differences in metabolite expression in Lrp6−/− vs. Lrp6+/+ mouse embryos.
Unpaired t-test results are depicted for some metabolites from Table 1 that were observed statistically different between Lrp6+/+ and Lrp6−/− embryos. Raw data values were exported to Prism 6 (GraphPad Software Inc.) for repeated statistical testing (*= p<0.05, **= p<0.01, ***= p<0.001). Bars represent mean ion counts +/− standard error of the means.

