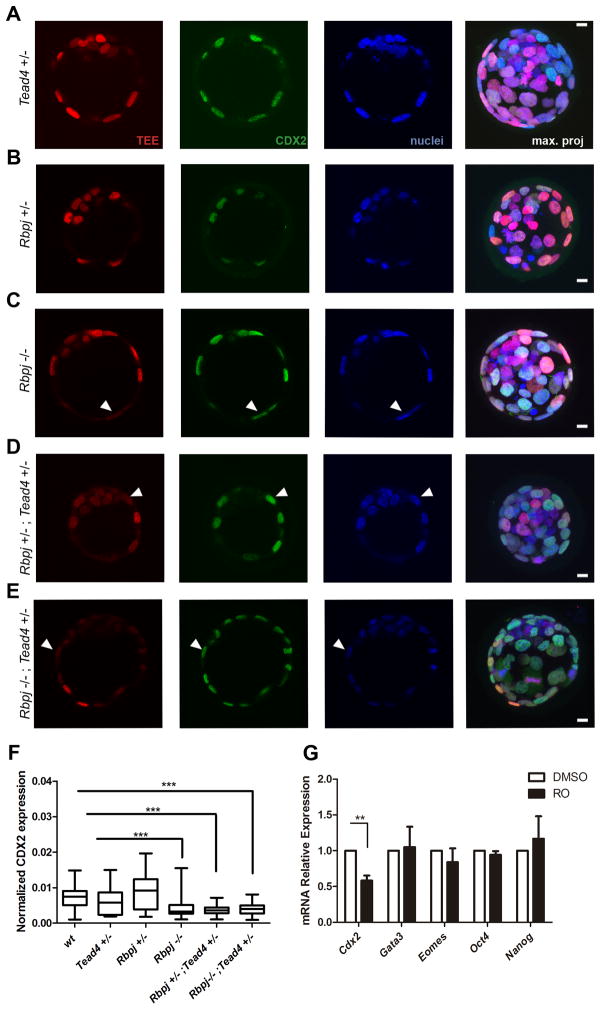
Figure 5. TEE activity and Cdx2 expression require transcriptional inputs from Notch and TEAD4.
(A–E) TEE activity (red) and CDX2 immunodetection (green) in (A) Tead4+/−, (B) Rbpj+/−, (C) Rbpj−/−, (D) Rbpj+/−;Tead4+/−, and (E) Rbpj−/−;Tead4+/− mutant embryos. Nuclei were stained with DAPI. Arrowheads in C–E indicate TEE-;Cdx2+ outer blastomeres. Maximal projections of merged images are shown in the right panels. Scale bars, 10 μm. (F) Quantified CDX2 expression in outer cells of wild type blastocysts (n=89, 3 embryos) and in Tead4+/− (n=140, 3 embryos), Rbpj+/− (n=128, 4 embryos), Rbpj−/− (n=150, 4 embryos), Rbpj+/−;Tead4+/− (n=115, 4 embryos) and Rbpj−/−;Tead4+/− allelic combinations (n=159, 3 embryos). Boxes span the 25th to the 75th percentile, internal horizontal lines indicate median values, and whiskers show minima and maxima. ***p<0.001 by Bonferroni post test. (G) Relative expression of Cdx2, Gata3, Eomes, Oct4 and Nanog in pools of 25 embryos (n=6) treated from 2-cell until blastocyst stage with DMSO or RO. Data are means ± s.e.m. **p<0.01 by Student’s t-test. See also Figure S5.

