
Figure 4. Activation of CEl PKC-δ+ neurons inhibits feeding.
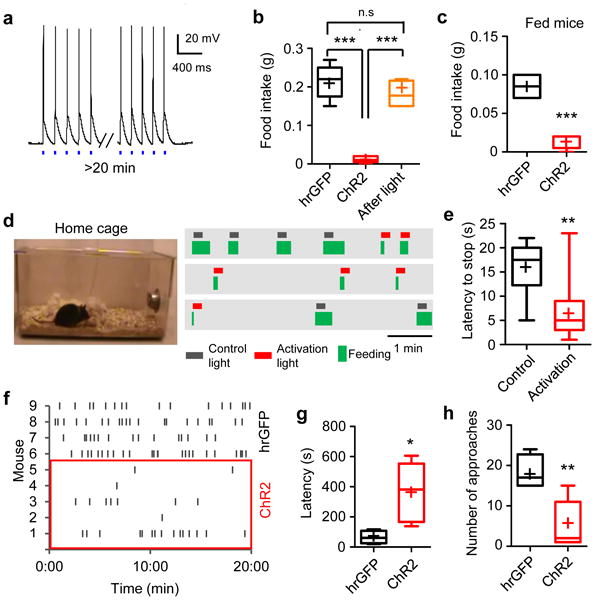
a. Brain slice whole-cell patch clamp recording traces showing action potentials triggered in PKC-δ+ neurons expressing ChR2 by 5 Hz, 10 ms 473 nm laser pulses. b-c. Food intake by 24 h fasted (b) and fed (c) animals expressing control protein hrGFP (n = 4) or ChR2 (n = 5). Mice expressing ChR2 were allowed to continue feeding for an additional 20 min after photostimulation offset (b, orange bar, n = 4). One-way ANOVA adjusted with Bonferroni's correction, F(2, 10) = 45.1, p < 0.0001 (b); Unpaired t-test, t(7) = 8.02, p < 0.0001 (c). d. Raster plots showing feeding episodes by one animal in its home cage. Activation light (473 nm) or control light (571 nm) was triggered 1-2 seconds after feeding began. 5 Hz, 10 ms light pulses were delivered for 10 seconds. e. Latency to stop feeding in response to photostimulation. n = 8 (control), and 11 (activation) trials from 4 animals. Unpaired t-test, t(17) = 3.15, p = 0.0058. f. Raster plot of food approaches in 24 h fasted animals. g. Latency of the first approach to food. Unpaired t-test, t(7) = 2.9, p = 0.022. h. Number of food approaches during a 20 min test. Unpaired t-test, t(7) = 3.6, p = 0.0083. Box plots show mean (+), median, quartiles (boxes), and range (whiskers). n.s., not significant; * p < 0.05, ** p < 0.01, *** p < 0.001.