
Figure 5. Activation of CEl PKC-δ+ neurons does not increase anxiety.
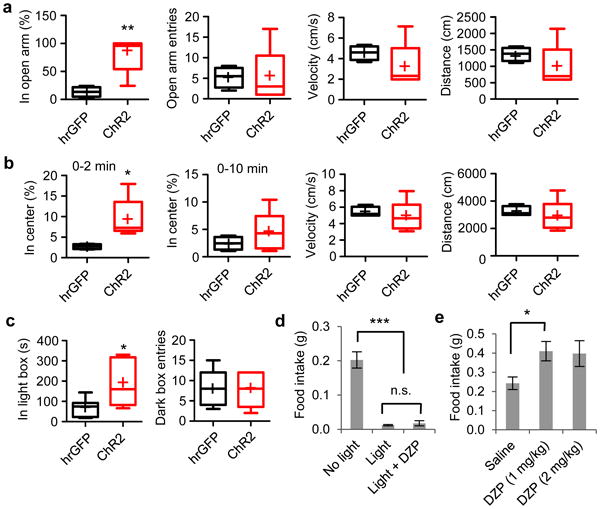
a-c. Optogenetic activation of PKC-δ+ neurons during elevated plus maze (a), open field test (b), and light-dark box test (c). n = 5 mice expressing ChR2 and n = 4 - 7 mice expressing control protein hrGFP. Box plots show mean (+), median, quartiles (boxes), and range (whiskers). Unpaired t-test, t(7) = 4.01, p = 0.0051 (a, in open arm); t(7) = 0.014, p = 0.99 (a, open arm entries); t(7) = 1.12, p = 0.30 (a, velocity); t(7) = 1.12, p = 0.30 (a, distance moved); t(7) = 2.74, p = 0.029 (b, in center, 0 – 2 min); t(7) = 1.04, p = 0.33 (b, in center, 0 – 10 min); t(7) = 0.60, p = 0.57 (b, velocity, 0 – 10 min); t(7) = 0.60, p = 0.57 (b, distance moved, 0 – 10 min); t(7) = 2.50, p = 0.031 (c, in light box), t(7) = 0.14, p = 0.90 (c, dark box entries). d. Food intake after injection of the anxiolytic drug diazepam (DZP). n = 4 (no light), 5 (light), 5 (light+ DZP) mice expressing ChR2 in each group. One-way ANOVA (F(2, 13) = 44.5, p < 0.0001) with post-hoc Bonferroni t-test indicated. e. Diazepam injected at a dose of 1 mg/kg increases food intake in wild type animals. n = 4 animals in each group. Unpaired t-test, t(6) = 2.78, p = 0.032. Values are means ± s.e.m.; n.s., not significant; * p < 0.05, ** p < 0.01, *** p < 0.001.