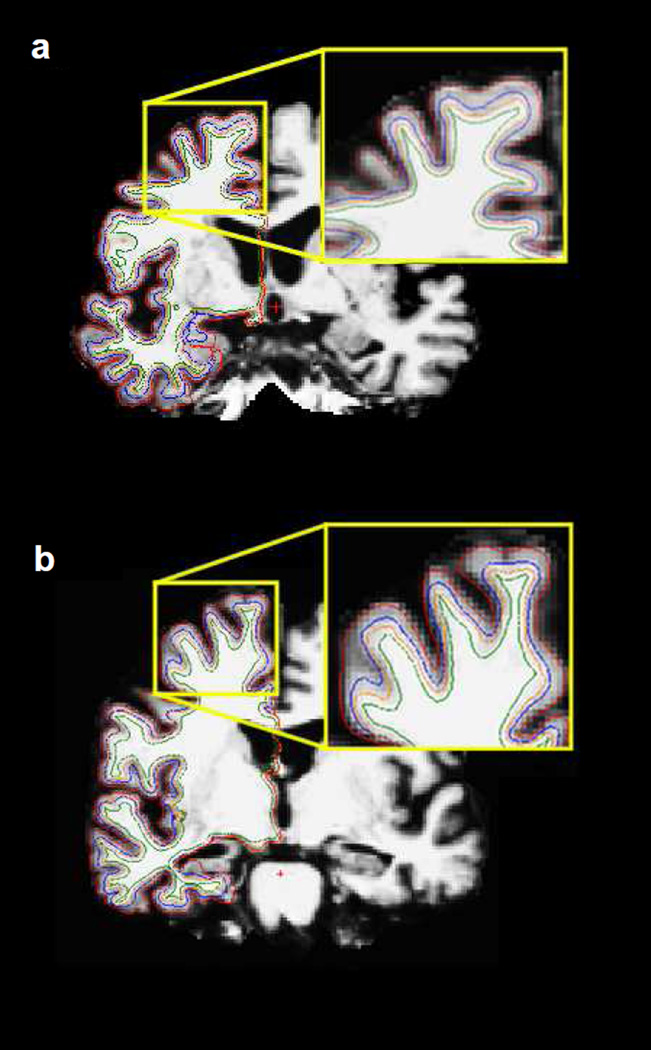
Figure 1. Illustration of GWR Protocol.
(a) Non-converter (76 year old man, MMSE=24) and (b) Converter (76 year old man, MMSE=24). Orange line=gray/white boundary; green line=white matter surface, generated 1mm below the gray/white boundary; red line=outer pial surface; blue line=gray matter surface, generated 35% of the way from gray/white boundary to pial outer boundary.

