
Figure 1.
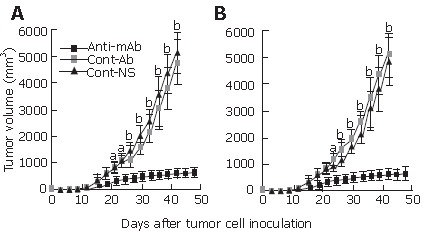
Tumor volumes at different time-points in Hepal-6 (A) and H22 (B) models. Cont-Ab: mice transfused with control antibodies; Cont-NS: mice transfused with NS; anti-mAb: mice transfused with anti-endoglin mAb. aP < 0.05, bP < 0.01. Data are shown as mean ± SD, n = 10 in each group.