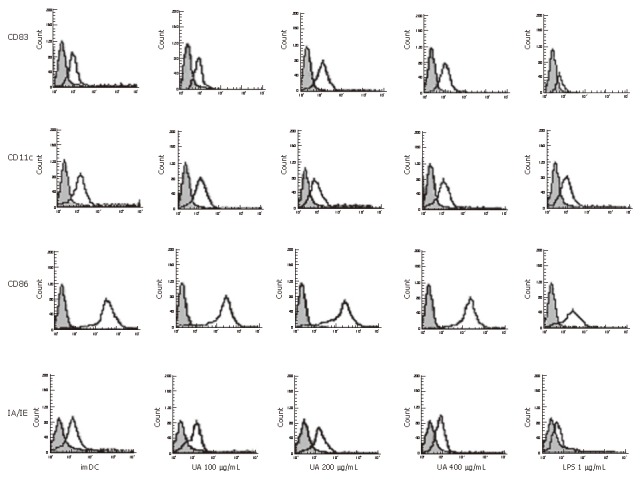
Figure 1.

The cell surface markers analysis on dendritic cells by flow cytometry after exposure to uric acid or LPS. Bone marrow-derived DCs were stimulated with 100, 200 and 400 μg/mL uric acid or 1 μg/mL LPS or Serum-free RPMI media 1640 for 48 h and immunostained with mAbs against CD11c, CD83, CD86 and IA/IE molecules (open histograms). Shade histograms represent the isotype control mAb staining of the cells. The histograms (Figure 1) and data (Table 1) are representative of five independent experiments.
