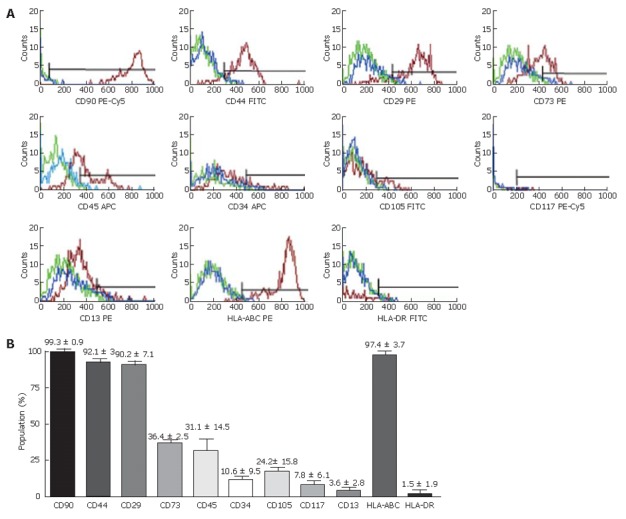
Figure 2.

Flow cytometry analysis of purified LECs. A: Flow cytometry histograms showing three cell populations isolated from different livers. Antigens expression was detected with specific antibodies (red). Isotype-matched antibody controls (blue) and auto-fluorescence (green) showing the non-specific fluorescent labeling; B: Mean expression percentage of analyzed cell markers obtained from three different LEC populations after the third passage.
