Figure 7.

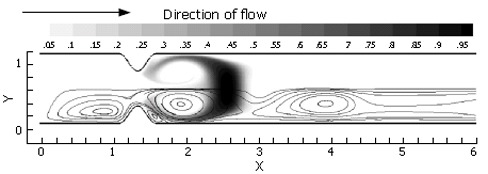
Scalar species distribution following the active phase of one inlet pulse (t = 2.5 time units, Re = 333), illustrating vortical stretching and resultant increase in interfacial area between regions of concentration 1.0 and 0.0.

Scalar species distribution following the active phase of one inlet pulse (t = 2.5 time units, Re = 333), illustrating vortical stretching and resultant increase in interfacial area between regions of concentration 1.0 and 0.0.