
Figure 4.
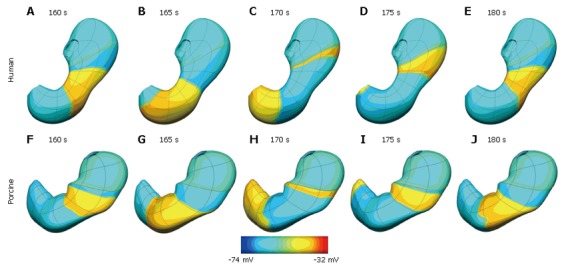
Simulation results at five second intervals showing gastric slow wave activity wave in a human (A-E) and porcine (F-J) stomach. The human stomach has a dominant frequency of 3.0 cpm while the porcine model has a dominant frequency of 3.7 cpm. Shown above is the transmembrane potential distribution on the outer surface of the stomach coloured by the scale bar below the images.