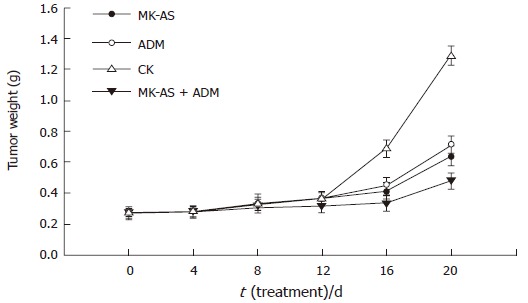
Figure 3.

Tumor growth in situ human HCC model after treatment with MK-AS and/or ADM. CK: Treatment with saline; ADM: Treatment with ADM; MK-AS: Treatment with MK-AS; ADM + MK-AS: Combination of ADM with MK-AS. Each value represents the mean ± SD from 7 determinations.
