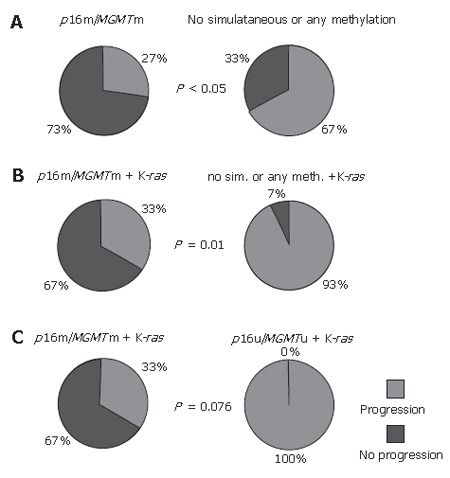
Figure 2.

Graphical distribution of progression of the disease in the two-year period, as a function of simultaneous p16 and MGMT methylation status (A); simultaneous p16, MGMT methylation and mutated K-ras gene compared either to no simultaneous or any methylation of two genes (B) or to unmethylated both (C), respectively.
