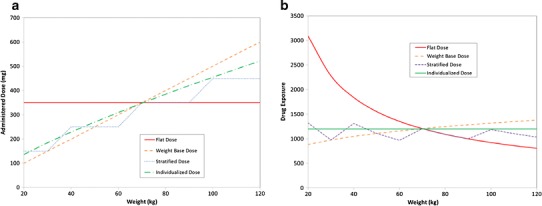
Fig. 1.

Example of differences between patient exposure following different dose metrics. In this figure, several dose metrics are tested, a flat dose, weight-based dose (mg/kg), stratified dosing and individualized dosing. The underlying clearance model was CL = 0.29 × (weight/70)0.75. Panel A is the administered dose for each regimen. Panel B is the associated patient exposure. Because clearance is related to weight, the exposure is very high with a flat dose regimen. However, dosing based on milligrams per kilogram assumes a linear relationship between clearance and weight, which is incorrect. Thus, low weight patients have much lower exposure than high weight patients. With stratified dosing, the exposure is more consistent over the range of weights examined. As might be expected, individualized dosing provides consistent exposure across all weights
