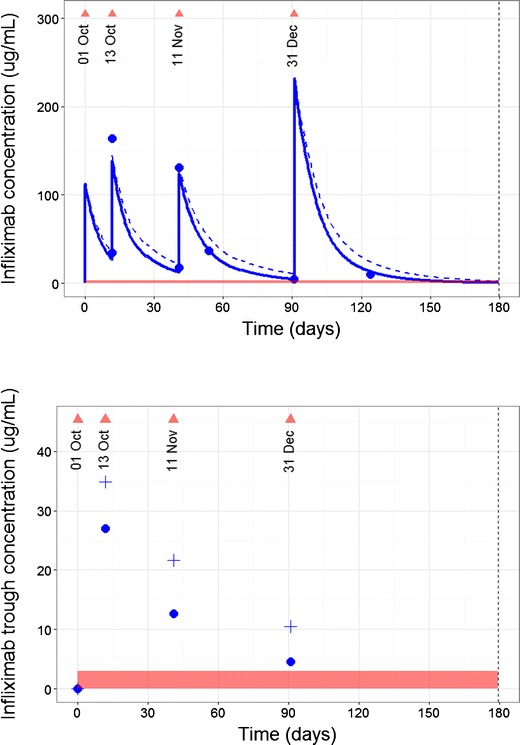
Fig. 6.

Predicted and forecast infliximab concentrations. Upper: The predicted and actual infliximab concentrations (blue dots) for a patient and were used to update a population PK model using Bayes estimation. The triangles are infliximab doses. The horizontal axis shows days since the commencement of infliximab treatment. The dashed line shows the predicted group infliximab concentration for a patient with matching covariate characteristics (e.g., Fig. 5) giving the individual infliximab time-course shown by the solid line. Although the peak from the dose given on 31 Dec was greater than previous doses, it was not sufficient to give trough concentrations above target by the time of next clinic visit. Lower: The predicted infliximab trough concentrations for the patient. The vertical line indicates “now”, the time of the current clinic visit. The four triangles show clinic visits with an infliximab dose. The crosses show the predicted group infliximab trough concentration for a patient with matching characteristics (e.g., Fig. 5). The individual infliximab trough concentrations following a Bayes update of the model are shown by the circles. Trough concentrations for this patient are lower than expected based on a matching individual in the population (group prediction), suggesting a higher than expected clearance. The model now accounts for this higher clearance for forecasting future doses
