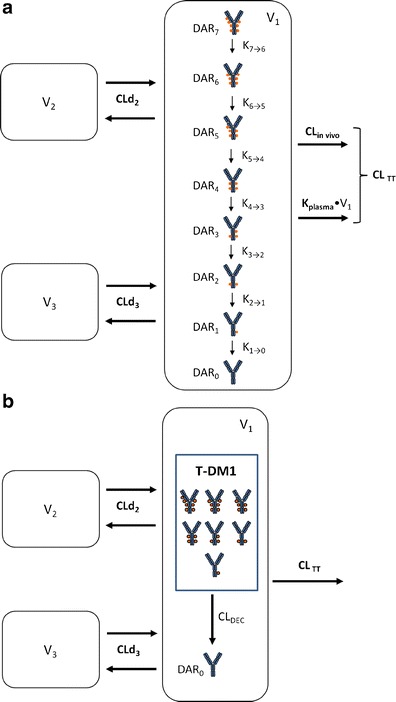
Fig. 1.

a Schematic of the mechanistic T-DM1 PK model describing the concentration–time course of individual DAR0–DAR7 moieties and TT based on ELISA and affinity capture LC-MS data. DM1 molecules (filled circles) are shown linked to trastuzumab in generic locations for illustration only. T-DM1 trastuzumab emtansine, PK pharmacokinetic, TT total trastuzumab, CL TT TT clearance from the central compartment, CL in vivo in vivo antibody clearance from the central compartment, equal to CLTT − k plasma × V 1, CLd 2 distributional clearance 2, CLd 3 distributional clearance 3, DAR n n DM1 molecules bound to trastuzumab (drug-to-antibody ratio), k plasma rate constant for antibody degradation in plasma, supported by in vitro data, k n → n − 1 rate constant for DM1 deconjugation from higher DAR moiety to next moiety in the chain, V 1 volume of distribution of central compartment, V 2 volume of distribution of peripheral compartment 2, V 3 volume of distribution of peripheral compartment 3. b Schematic of the reduced T-DM1 PK model describing the time course of T-DM1 and TT based only on ELISA data. T-DM1 is defined as any trastuzumab molecule with at least one linked DM1 molecule. DM1 molecules (filled circles) are shown linked to trastuzumab in generic locations for illustration only. CL DEC deconjugation clearance from T-DM1 to unconjugated trastuzumab (DAR 0). Additional parameters are as defined in Fig. 1a. T-DM1 trastuzumab emtansine, TT total trastuzumab
