
Fig. 3.
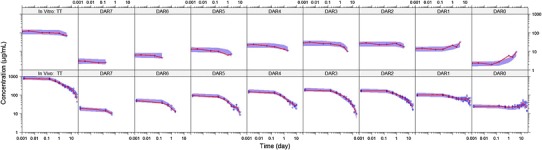
VPCs of TT and DAR0–DAR7 concentrations for the mechanistic deconjugation model fit to data from: top, In vitro cynomolgus monkey plasma stability study with 100 μg/mL T-DM1DAR 3.1; bottom, cynomolgus monkey PK study with 30 mg/kg T-DM1DAR 3.1. For all plots, the shaded area is the 50th percentile with 95% CI, and the solid red line is the median of the observed data (blue circles). Both axes are shown on log scale for visualization purposes. VPC visual predictive check, TT total trastuzumab, DAR drug-to-antibody ratio, T-DM1 trastuzumab emtansine, PK pharmacokinetic