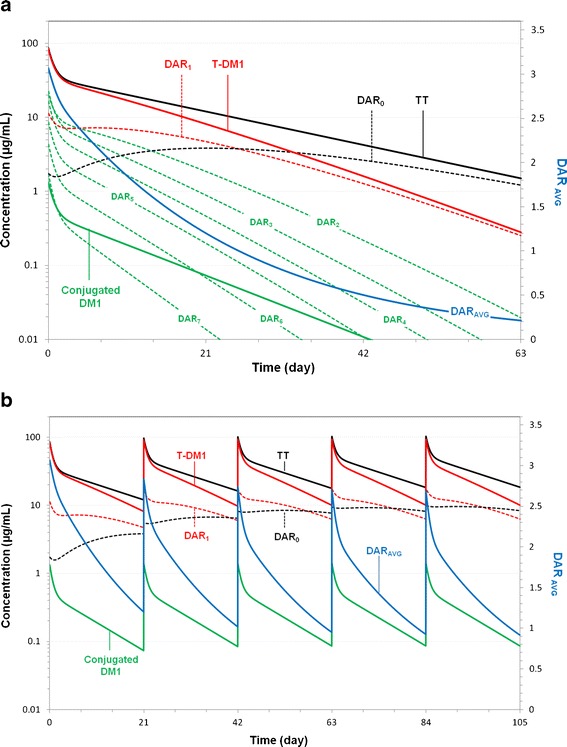
Fig. 5.

Model predictions of TT, T-DM1, conjugated DM1; DAR0–DAR7 concentration–time curves; and DARAVG–time curve, based on the final parameter estimates from the mechanistic T-DM1 PK model fit to cynomolgus monkey data. The T-DM1 curve is the composite of the seven curves representing DAR1–DAR7 moieties. The TT curve is the composite of the 8 curves representing DAR0–DAR7 moieties. Predictions are for a cynomolgus monkey administered a single dose of 3.6 mg/kg T-DM1DAR 3.1 and b cynomolgus monkey administered multiple q3w doses of 3.6 mg/kg T-DM1DAR 3.1. DAR AVG average drug-to-antibody ratio, TT total trastuzumab, T-DM1 trastuzumab emtansine, PK pharmacokinetic
