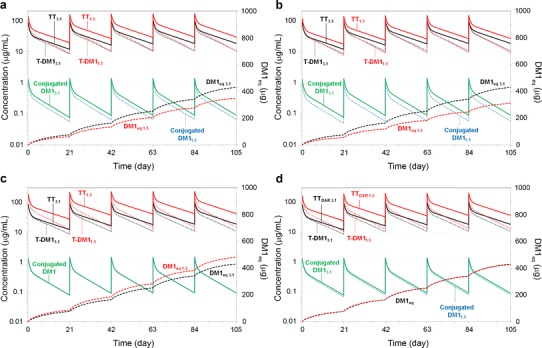
Fig. 6.

Model predictions of TT, T-DM1, and conjugated DM1 concentration–time curves and the cumulative DM1eq–time curve, based on the final parameter estimates from the mechanistic T-DM1 PK model fit to cynomolgus monkey data; subscripts on plots (i.e., 1.5 and 3.1) indicate whether predictions are from the T-DM1DAR 1.5 or T-DM1DAR 3.1 dose product. Predictions for conjugated DM1 and DM1eq are equivalent between dose products in Fig. 6c, d, respectively. Predictions are for cynomolgus monkeys administered multiple q3w doses of 3.6 mg/kg T-DM1DAR 3.1 and a 5.8 mg/kg T-DM1DAR 1.5; b 5.16 mg/kg T-DM1DAR 1.5; c 8.0 mg/kg T-DM1DAR 1.5; and d 7.1 mg/kg T-DM1DAR 1.5. DM1eq = DM1 equivalents; TT total trastuzumab, T-DM1 trastuzumab emtansine, PK pharmacokinetic
