
Fig. 1.
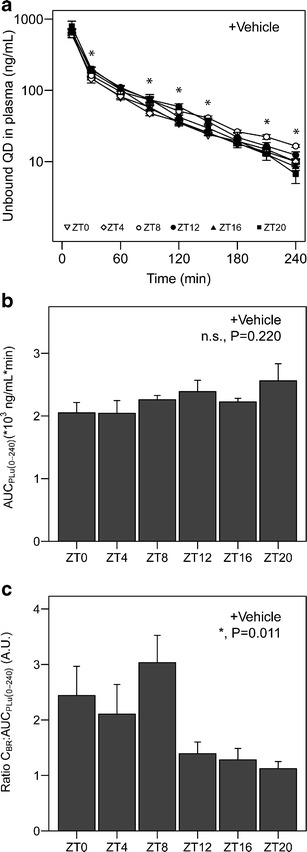
Quinidine exposure in plasma and brain in vehicle-treated animals. a Time–concentration profiles of unbound quinidine in plasma. Different symbols represent the different experimental time points (ZT0, 4, 8, 12, 16, and 20). Asterisks indicate significant effect of ZT on plasma concentration at the designated sampling times (n = 6–8 animals per group). b Area under the curve for unbound quinidine in plasma from 0 to 240 min after administration (AUCPLu,0–240) at different experimental time points (n = 5–8 animals per group). No significant time of day effect on AUCPLu,0–240 was found (p > 0.05, one-way ANOVA). c Quinidine concentration at t = 240 min in brain homogenate relative to plasma AUC (CBR:AUCPLu,0–240) at different experimental time points (n = 4–8 animals per group). Time of administration significantly affects this ratio (p < 0.05, Kruskal–Wallis rank sum test). Mean ± SEM in all graphs. n.s. not significant; *p < 0.05