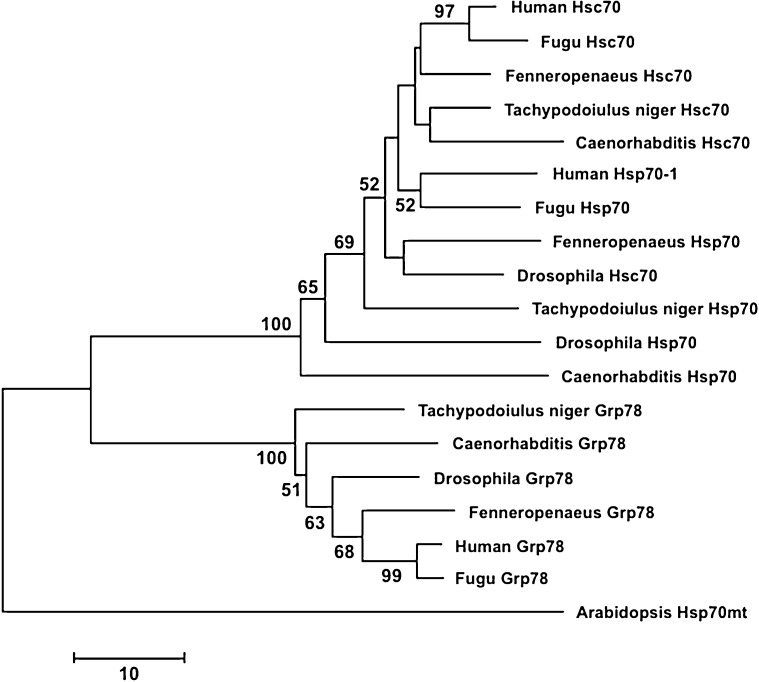
Fig. 3.
Neighbour-joining network illustrating the clustering of hsp70 family sequences. The predicted protein sequences of 18 hsp70s homologues that mostly represent model organisms (Caenorhabditis elegans: hsp70 [NP_492485], hsc70 [NP_503068], grp78 [NP_495536]; Drosophila melanogaster: hsp70 [NP_731651], hsc70 [NP_524356], grp78 [NP_727563]; Fenneropenaeus chinensis: hsp70 [ACN38704], hsc70 [AAW71958], grp78 [ABM92447]; Takifugu rubripes: hsp70 [CAA69894], hsc70 [XP_003966054], grp78 [XP_003965205]; and Homo sapiens: hsp70 [AAD21816], hsc70 [NP_006588], grp78 [NP_005338]) were compiled in a 188 AA long alignment with the predicted protein sequences from Tachypodoiulus niger (hsp70 [CAM7362], hsc70 [CAM73262], grp78 [CAM73265]). Analyses were carried out using MEGA 5.2.1 (Tamura et al. 2011). The network is based on the number of sequence differences with pairwise deletion of gaps, and bootstrap support was estimated from 1 000 replicates. The bootstrap support was estimated from 100 replicates; only values ≥50 are indicated. The mitochondrial hsp70 from Arabidopsis thaliana [NP_195504] served as an out-group. (Accession numbers in brackets.)

