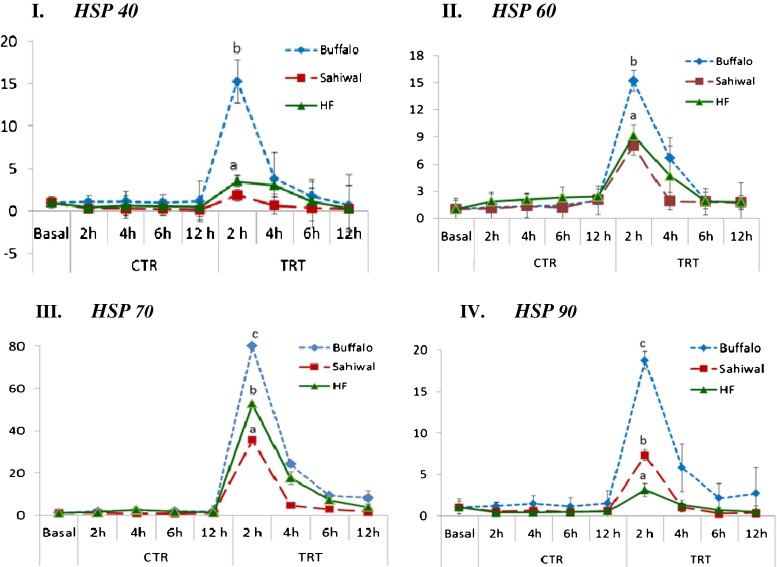
Fig. 3.
Overall mRNA abundance of different heat shock protein (HSP) genes in heat stressed (TRT) and unstressed (CTR) PBMCs across Murrah buffaloes, Sahiwal cows, and HF cows. I HSP40, II HSP60, III HSP70, and IV HSP90. For all graphs, y-axis represent relative mRNA expression and x-axis represent the time points. Values with different letters are significantly different (p ≤ 0.05); HF Holstein–Friesian, h hour

