Figure 4.

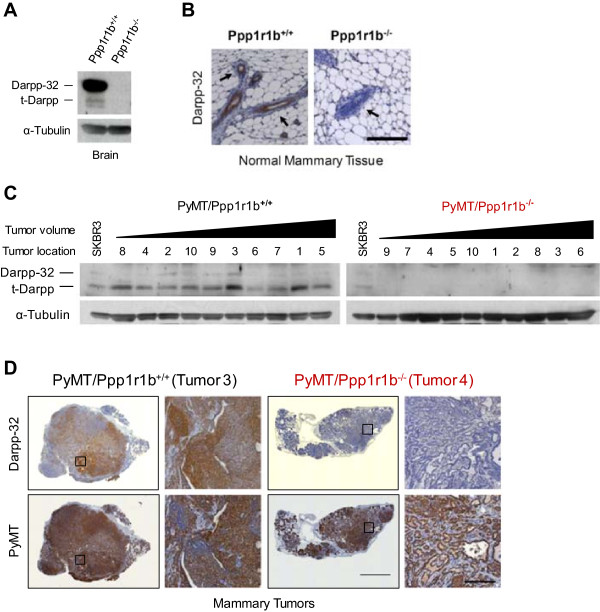
Darpp-32 and t-Darpp expression in Ppp1r1b knockout mice. (A) Western analysis of Darpp-32 and t-Darpp protein levels in brain tissue from wild-type (Ppp1r1b+/+) and knockout (Ppp1r1b-/-) mice. α–Tubulin was used as a loading control. (B) Mammary pads (abdominal and inguinal, #4/5) were collected from 20-week-old Ppp1r1b+/+ and Ppp1r1b-/- mice. Formalin-fixed sections were stained for Darpp-32 (5× magnification, scale bar = 200 μm). Black arrows indicate mammary epithelial cells surrounded by the adipose tissue of the mammary fat pad. (C) Western analysis of Darpp-32 and t-Darpp protein levels in mammary tumor tissue. α–Tubulin was used as a loading control. All ten tumors were collected from 20-week-old wild-type (PyMT/Ppp1r1b+/+) and knockout (PyMT/Ppp1r1b-/-) mice carrying the MMTV-PyMT transgene. Tumor samples are arranged from smallest to largest (tumor volume) and the tumor location is specified. SKBR3 human breast cancer cells were used as a reference for Darpp-32 and t-Darpp expression. (D) Mammary tumor samples were formalin-fixed and serial sections were stained for Darpp-32 and PyMT (5× magnification in a 6 × 6 tile, scale bar = 2000 μm; images enlarged from the boxed regions are at 10× magnification, scale bar = 200 μm). Tumor numbers correspond to the numbering in panel C.
