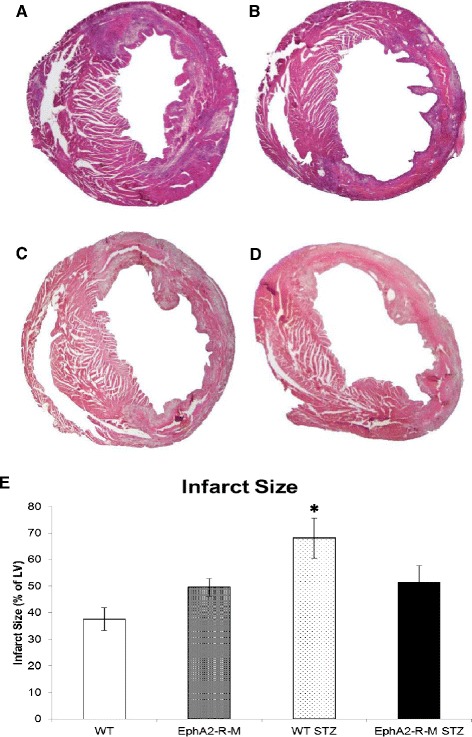
Figure 2.

Infarct size in WT and EphA2-R-M Normo-and Hyperglycemic mice. Representative images of H&E stains (x20) of normoglycemic WT mouse heart (A) and EphA2-R-M (B), and hyperglycemic WT (C) and EphA2-R-M (D) mouse hearts. Infarct size (E) in WT mice was 45% larger in WT hypergylcemic mice compared with normoglycemic mice (p < 0.01). EphA2-R-M mice had slightly with slightly larger infarcts but this was not exacerbated by hyperglycemia (E).
