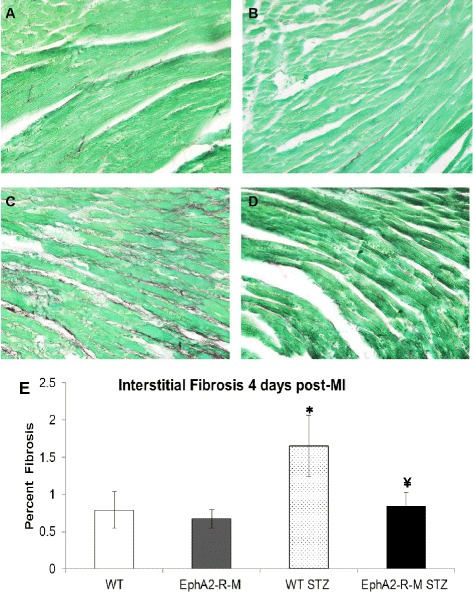
Figure 3.

Interstitial Fibrosis. Representative images (x400) of normoglycemic WT mouse heart (A) and EphA2-R-M (B), and hyperglycemic WT (C) and EphA2-R-M (D) mouse hearts stained with picrosirius red and fast green. Percent interstitial fibrosis (E) was elevated in hyperglycemic WT mice 4 days post-MI (*, p < 0.05) compared to normoglycemic WT hearts and hyperglycemic EphA2-R-M mouse hearts (¥, p < 0.01).
